How to use Omnibug in Edge
This article covers how to install and open Omnibug within the Microsoft's Chromium version of Edge. You should have already installed Omnibug, but if you haven't, please be sure to see the installation page for how to install Omnibug.
Once Omnibug has been installed, go to Chrome's extension page which can be visited by going to the main Chrome menu,
"More tools", and finally "Extensions". You can also visit it by entering edge://extensions/ into the URL bar. On
the extensions page, you should see Omnibug listed (you can also search for it).
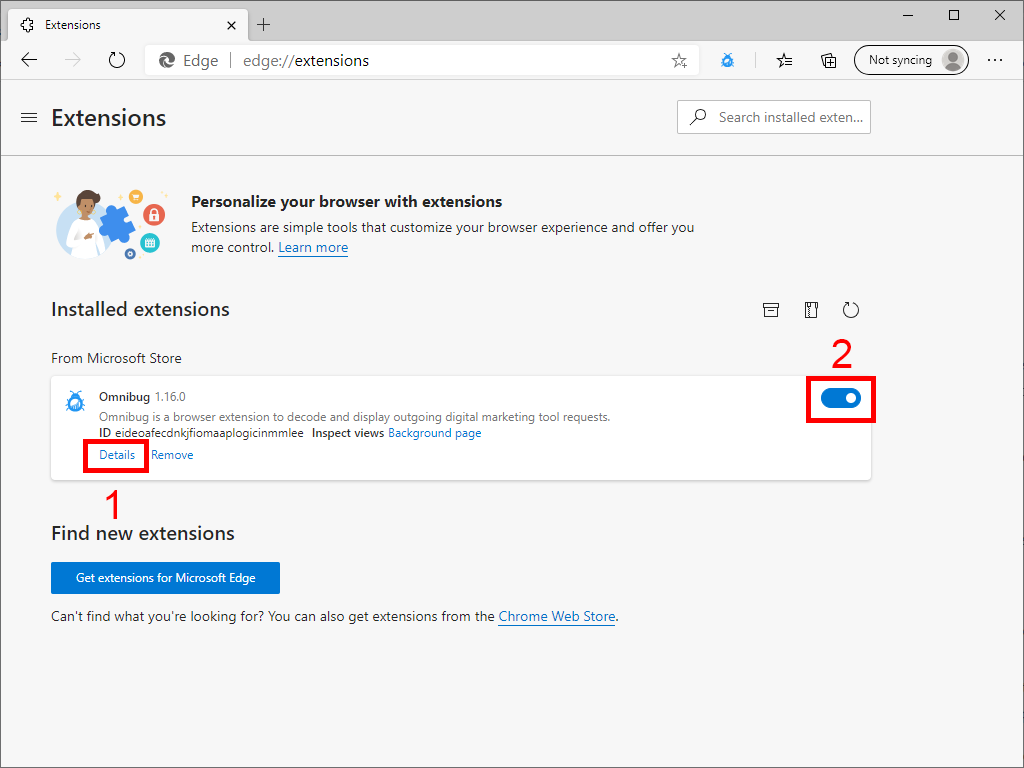
In the figure above, there are two main points to make sure of. Clicking Details will let you update various settings, and the checkbox in the lower right corner (2) should be checked, otherwise Omnibug will be disabled and will not work. Clicking on the details (1) should open a new modal window with information about Omnibug, as well as a few links. Click on this.
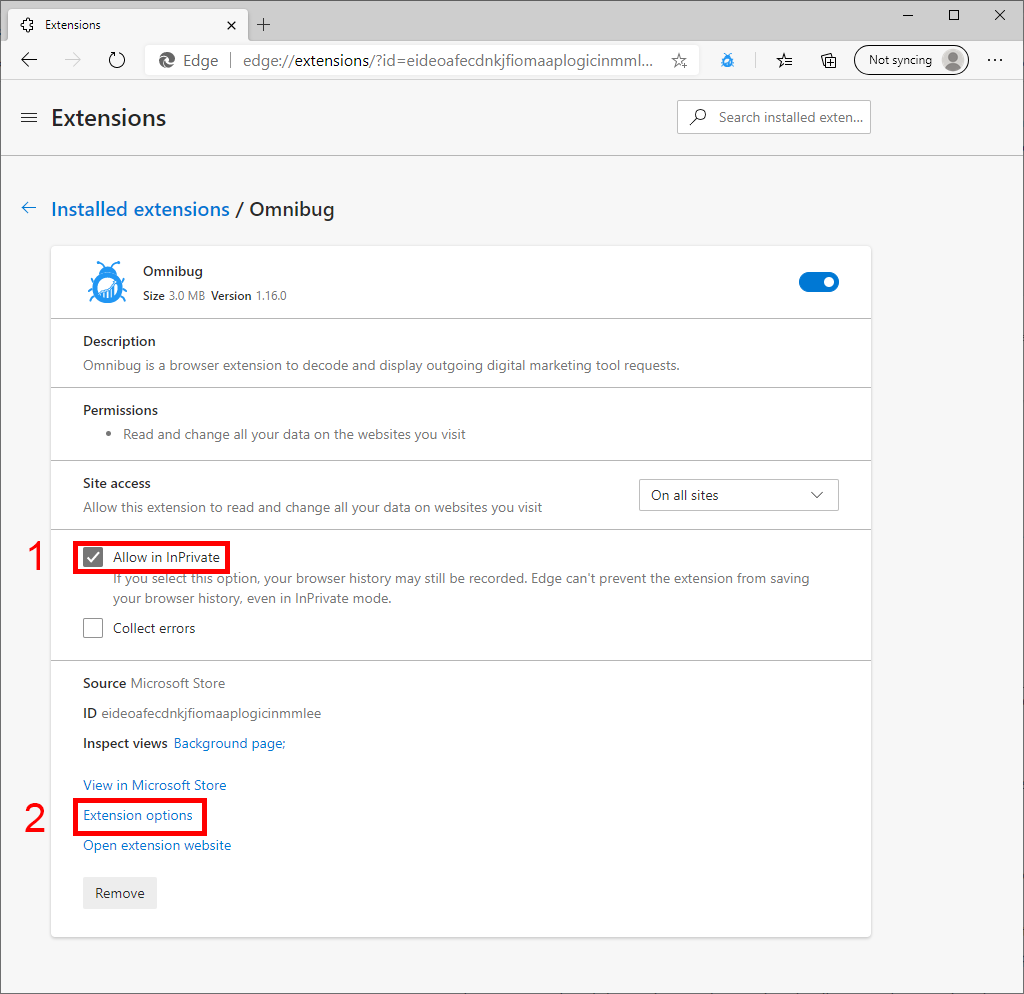
On the details page, the "Allow in InPrivate" checkbox (1) can be checked if you want to allow Omnibug to work in Edge's InPrivate mode. We recommend that you allow this, but not required if you do not use Edge's InPrivate mode. Clicking on the Extension options (2) will let you set Omnibug-specific settings. Learn more about these settings.
Now that we've explored the settings and extension details pages, let's get into how to use Omnibug. Omnibug primarily runs as a developer tools panel. You can open the developer tools via multiple ways:
- Pressing
F12 - Pressing
ctrl + shift + i(ctrl + option + ifor Mac) - Right clicking on the page, then going to "Inspect Element"
- Opening Edge's main menu > "More Tools" > "Developer Tools"
Each browser tab or window can have their own developer tools window opened, so be sure to open the developer tools for the correct window!
Once you've opened the developer tools, there should be a tab named "Omnibug". Click on that, and you'll have opened Omnibug! From there, Omnibug will listen to the page for requests and display them in the developer tools window.